
Investment performance metrics are essential tools for investors who want to track how well their investments are doing. These metrics help measure profitability, assess risk, and compare different investment options. By understanding these indicators, investors can make informed decisions, optimize their portfolios, and achieve better long-term financial results.
In this guide, we will explore the top investment performance metrics every investor should know. From basic measures like ROI to advanced metrics like the Sharpe Ratio and maximum drawdown, this guide explains how each metric works and how it can help investors evaluate performance effectively and manage risk wisely.
Return on Investment (ROI)

Investment performance metrics often start with one of the simplest yet most important measures: Return on Investment, or ROI. ROI shows the profitability of an investment by comparing the gain or loss relative to the original amount invested. The formula is straightforward: ROI = (Net Profit / Investment Cost) × 100. This calculation provides a clear percentage that tells investors how much they earned or lost from a particular investment.
ROI helps investors quickly evaluate whether a specific investment is worthwhile. For example, if you invested $1,000 in a stock and it grew to $1,200, your ROI would be 20%. Similarly, if an investment loses value, ROI shows the negative impact clearly. This makes ROI an essential part of investment performance metrics for anyone who wants to compare options or track historical gains.
The advantages of ROI are its simplicity and versatility. It can be applied to stocks, bonds, mutual funds, or even business ventures. Investors can easily compare the returns of different assets without complicated calculations. However, ROI has limitations. It does not account for the time period of an investment or the risk taken to achieve the return. Two investments may have the same ROI, but one could take years longer or involve higher risk. Despite these limitations, ROI remains a key investment performance metric because it provides a quick snapshot of profitability, helping investors make informed decisions efficiently.
Annualized Returns

Another critical component of investment performance metrics is annualized returns. Unlike simple ROI, annualized returns account for the time over which an investment grows. This measure expresses the average yearly return of an investment, making it easier to compare investments of different durations. For instance, earning 20% over two years is different from earning 20% in one year, and annualized returns help clarify that difference.
To calculate annualized returns, you can use the formula: (EndingValue/BeginningValue)(1/NumberofYears)−1(Ending Value / Beginning Value) ^ (1 / Number of Years) – 1(EndingValue/BeginningValue)(1/NumberofYears)−1 × 100. This converts total returns into an annual percentage, showing how much an investment grows each year on average. Whether evaluating a short-term investment like a bond or a long-term investment like a retirement fund, annualized returns give a consistent basis for comparison.
The main benefit of annualized returns as an investment performance metric is its ability to normalize performance over time. Investors can compare short-term and long-term investments on equal footing. However, it does not reflect the risk taken or market volatility, so it should be considered alongside other metrics. Despite its limitations, annualized returns remain a vital part of investment performance metrics, helping investors understand true growth rates and make better decisions across varying investment horizons.
Risk-Adjusted Returns
Risk-adjusted returns are a critical aspect of investment performance metrics because they help investors understand the balance between risk and reward. Simply looking at raw returns may be misleading. Two investments might provide the same return, but one may involve significantly higher risk. Risk-adjusted metrics address this by factoring in volatility, providing a clearer picture of performance relative to risk taken.
Common metrics include the Sharpe Ratio, Treynor Ratio, and Sortino Ratio. The Sharpe Ratio measures excess return per unit of total risk, helping investors compare portfolios. The Treynor Ratio focuses on systematic risk, while the Sortino Ratio considers downside risk, which is often more relevant for cautious investors. These metrics allow investors to see which investments offer better returns for the risk they assume, making them crucial investment performance metrics for portfolio management.
Alpha and Beta
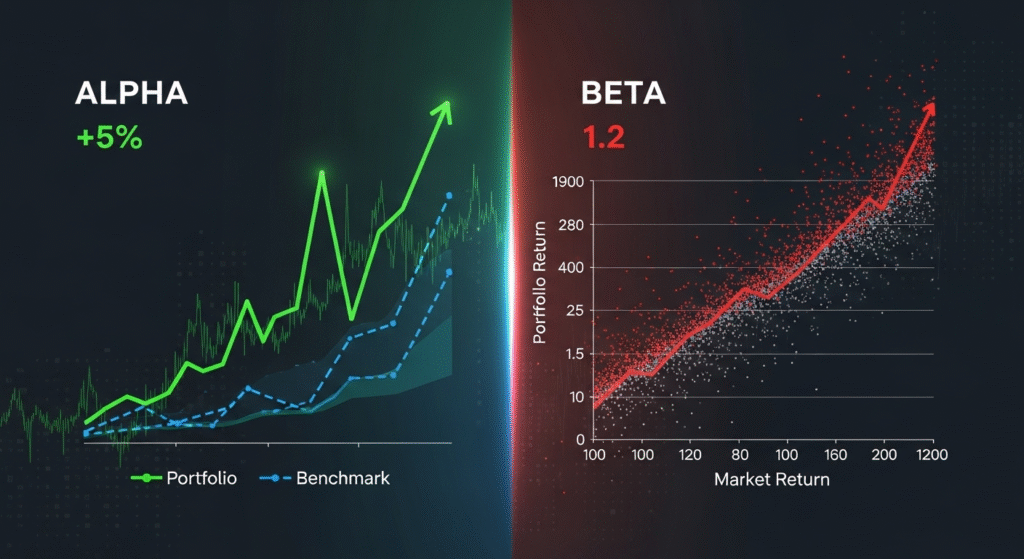
Investment performance metrics often include Alpha and Beta, which help investors understand risk and return in relation to the market. Alpha measures how an investment performs compared to a benchmark index, such as the S&P 500. A positive Alpha indicates that the investment outperformed the benchmark, while a negative Alpha shows underperformance. Investors use Alpha to evaluate fund managers or individual stocks to see whether they provide added value beyond market performance.
Beta, on the other hand, measures an investment’s volatility relative to the market. A Beta of 1 means the investment moves in line with the market. A Beta greater than 1 indicates higher volatility, while less than 1 suggests lower volatility than the market. By assessing Beta, investors can gauge how sensitive their investment is to market fluctuations, helping manage overall portfolio risk.
Using Alpha and Beta as investment performance metrics allows investors to make informed decisions about risk-adjusted returns. For example, a fund with high Alpha and moderate Beta is desirable because it provides above-market returns without excessive volatility. Conversely, a high Beta with negative Alpha may indicate poor performance with high risk. These metrics are essential for portfolio assessment and asset allocation.
While Alpha and Beta provide valuable insights, they have limitations. Alpha depends on the chosen benchmark, and Beta only measures historical volatility, which may not predict future movements. Despite this, these metrics remain a crucial part of investment performance metrics, helping investors balance risk and reward effectively and make smarter portfolio decisions.
Expense Ratios and Fees
Expense ratios and management fees are key investment performance metrics that impact net returns. Every mutual fund or exchange-traded fund (ETF) charges a fee to cover management and operational costs. The expense ratio is expressed as a percentage of assets under management. Even small fees can significantly reduce long-term returns, especially over decades of investing. Understanding these costs is vital for building a profitable portfolio.
Investors should evaluate fees carefully before investing. Low-cost funds often provide similar performance to high-cost funds after accounting for fees. Comparing expense ratios, load fees, and transaction costs helps investors choose investments that maximize net returns. Online tools and fund reports can help track these expenses as part of investment performance metrics.
The importance of monitoring expense ratios extends to long-term portfolio growth. High fees reduce compounding benefits, meaning investors earn less over time. By selecting funds with lower fees and high efficiency, investors enhance long-term returns without increasing risk. Evaluating expense ratios and fees is a simple but effective way to improve portfolio performance.
Maximum Drawdown
Maximum drawdown is a critical investment performance metric that measures the largest peak-to-trough loss in an investment over a specific period. It indicates how much an investor could have lost from the highest value to the lowest value during a market decline. By understanding maximum drawdown, investors can evaluate the worst-case scenario and gauge the potential risk associated with an investment.
This metric is particularly useful for risk assessment. Investors can compare drawdowns across different assets or funds to identify those with lower historical losses. It helps in portfolio construction by balancing high-return investments with lower drawdown alternatives, thereby reducing potential volatility.
Maximum drawdown also informs investment strategies. For example, investors can set stop-loss limits, diversify portfolios, or adjust asset allocation to minimize potential losses. While past drawdowns do not guarantee future outcomes, they provide a realistic perspective on market risks and volatility. As part of investment performance metrics, maximum drawdown is essential for maintaining financial stability and making informed investment decisions.
Portfolio Diversification Metrics
Diversification is a key factor in reducing risk, and investment performance metrics include tools to measure how well a portfolio is diversified. Correlation coefficients are commonly used to assess diversification. Investments that move independently or inversely to each other provide better risk reduction than highly correlated assets. By tracking these correlations, investors can ensure their portfolio is balanced and not overly exposed to a single market factor.
Effective diversification helps stabilize portfolio performance. If one asset underperforms, others may offset the losses, reducing overall volatility. Portfolio diversification metrics allow investors to identify concentration risks and improve asset allocation. Tools such as portfolio trackers and risk analysis software can monitor diversification and provide actionable insights.
Diversification also impacts long-term returns. Balanced portfolios that consider correlations and sector allocations can achieve smoother growth while minimizing risk exposure. Using these metrics, investors can optimize portfolios, maintain stability, and improve risk-adjusted returns. As part of investment performance metrics, diversification measures are essential for managing risk, enhancing performance, and achieving long-term investment goals.
Conclusion
Understanding investment performance metrics is essential for making informed financial decisions. These metrics, including ROI, annualized returns, risk-adjusted returns, Alpha, Beta, expense ratios, maximum drawdown, and diversification measures, help investors evaluate profitability, assess risk, and optimize portfolio performance. By regularly monitoring these indicators, investors can identify underperforming assets, manage risks, and make strategic adjustments. Using these metrics ensures long-term growth, financial stability, and better decision-making. Whether you are a beginner or an experienced investor, incorporating investment performance metrics into your investment analysis provides clarity, improves portfolio management, and strengthens confidence in achieving financial goals.
FAQs
What are the key measures to evaluate investments?
Key measures include profitability, risk, and return metrics. Investors often track how much an investment grows, its volatility, and costs like management fees. Metrics like ROI, annualized returns, and maximum drawdown give insights into performance and potential losses. By evaluating these factors, investors can compare different options, plan budgets, and choose investments that align with their financial goals. Regular monitoring helps improve long-term returns and manage risk effectively.
How can I assess investment risk?
Investment risk can be assessed by tracking volatility, Beta, and maximum drawdown. Volatility shows how much an asset’s price fluctuates. Beta measures sensitivity to market movements, while maximum drawdown indicates potential peak-to-trough losses. Combining these indicators helps investors understand potential losses and prepare for market swings. Regular evaluation ensures risk is balanced with expected returns. Using a variety of metrics gives a clearer picture of potential outcomes and supports safer investment decisions.
Why should I consider fees when investing?
Fees reduce overall investment returns, especially over the long term. Management fees, expense ratios, and transaction costs can significantly impact profitability. Evaluating fees helps investors choose low-cost funds or investment options that maximize net returns. Even small differences in costs can add up over years. By considering fees alongside other metrics, investors ensure their portfolio grows efficiently without unnecessary reductions in earnings, supporting better long-term financial outcomes and effective investment planning.