

Financial charts are essential tools for anyone looking to understand market trends and make informed investment decisions. These visual representations of price, volume, and time help beginners and seasoned investors alike identify patterns, trends, and potential opportunities. Learning to read financial charts effectively can boost your confidence in trading stocks, cryptocurrencies, or other assets, allowing you to make smarter, data-driven decisions.
In this beginners guide, we will break down the basics of financial charts, explain key terms, introduce essential indicators, and provide practical tips to help you analyze market movements like a pro. By following these steps, you’ll gain the skills to interpret charts with clarity and accuracy.
Understanding Financial Charts Basics
Financial charts are visual tools that help traders and investors understand market movements over time. The most common types of financial charts include line charts, bar charts, and candlestick charts. Line charts connect closing prices with a simple line, making it easy to see overall trends. Bar charts display open, high, low, and close prices for each time period, giving more detail than line charts. Candlestick charts are similar to bar charts but are visually easier to interpret, showing bullish or bearish movements with colored bodies.
The key elements of financial charts are price, volume, and time. Price represents the value of an asset at a specific moment, while volume indicates the number of shares or contracts traded. Time is displayed on the horizontal axis, helping users track how prices change over days, weeks, or months. Combining these elements allows traders to spot trends, reversals, and patterns in the market.
Reading Price Movements

Reading price movements is a crucial step when analyzing financial charts. Prices fluctuate over time, creating highs, lows, and closing prices. The high is the highest price during a specific period, the low is the lowest, and the closing price is the final trading price for that period. Observing these values helps investors understand the strength of a trend and market sentiment.
Bullish trends occur when prices consistently move higher, signaling investor confidence and potential buying opportunities. Bearish trends happen when prices fall steadily, indicating caution or selling pressure. Recognizing these trends on financial charts helps traders decide whether to buy, hold, or sell an asset.
Price patterns also provide insight into potential market reversals. Common patterns include double tops and bottoms, head and shoulders, and triangles. These formations indicate periods of accumulation, consolidation, or potential breakout points. By learning to identify highs, lows, and price patterns, beginners can make better trading decisions using financial charts.
Introduction to Technical Indicators
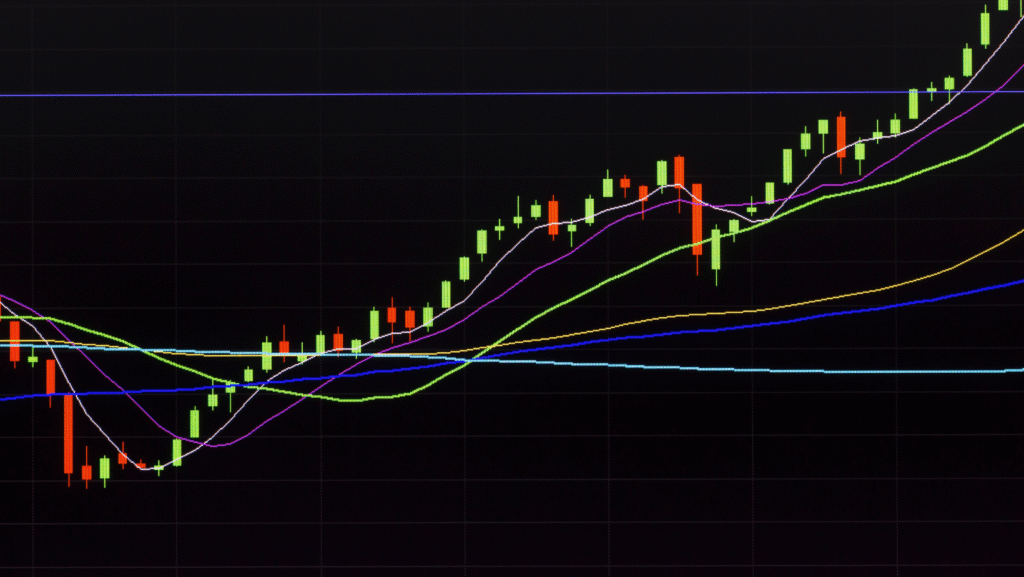
Technical indicators are tools that enhance the analysis of financial charts. They help traders predict market trends and make informed decisions. Common indicators include moving averages, Relative Strength Index (RSI), and MACD. Moving averages smooth out price data to reveal trends, while RSI measures overbought or oversold conditions. MACD, or Moving Average Convergence Divergence, indicates momentum and trend direction.
Indicators work best when combined with price action on financial charts. For example, if a bullish candlestick forms near a support level and RSI is oversold, it could signal a buying opportunity. Combining multiple indicators reduces false signals and improves accuracy.
Learning to use technical indicators allows beginners to anticipate market movements rather than react to them. By integrating indicators with financial charts, traders can make data-driven decisions, identify entry and exit points, and minimize risks.
Understanding Support and Resistance
Support and resistance levels are key concepts in reading financial charts. Support is a price level where an asset tends to stop falling due to increased buying interest. Resistance is where prices struggle to rise because selling pressure increases. Identifying these levels helps traders predict potential reversals and plan trades.
Support and resistance can be spotted by looking at historical price points where the market repeatedly bounces or falls. Horizontal lines are drawn on financial charts to mark these levels, providing a visual guide for traders. Using these levels, beginners can plan entry and exit points more effectively.
For instance, buying near support and selling near resistance can improve trade success. Additionally, when prices break through resistance or fall below support, it may signal a trend continuation. Understanding support and resistance is essential for interpreting financial charts and making informed trading decisions.
Volume Analysis
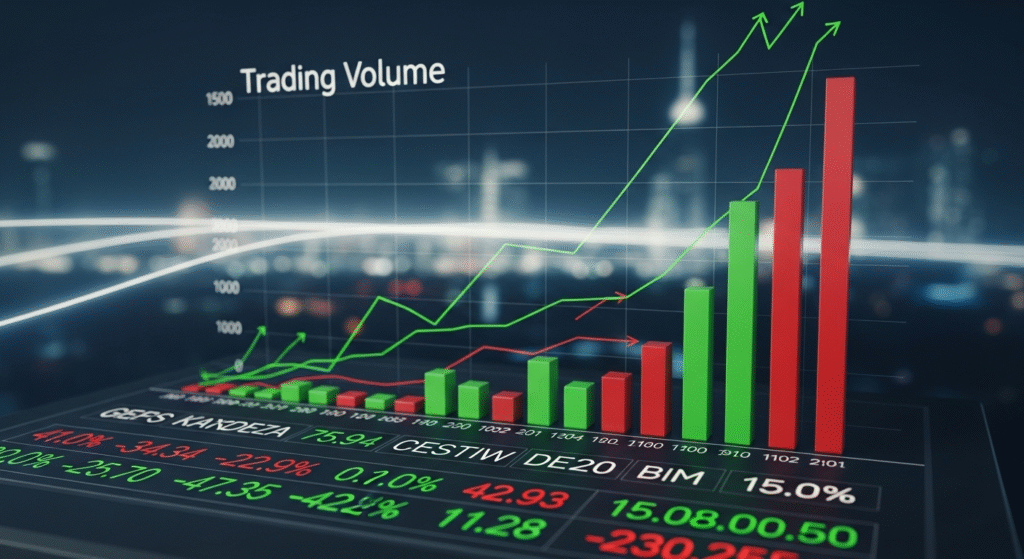
Volume analysis is an essential part of understanding financial charts. Trading volume refers to the number of shares, contracts, or units traded during a specific time period. By studying volume, traders can gauge the strength of a price movement and market interest. High volume during a price increase usually signals strong buying pressure, while high volume during a decline indicates selling pressure.
Volume spikes are particularly important on financial charts. Sudden increases in trading volume often accompany breakouts or breakdowns. For example, if a stock breaks through a resistance level with high volume, it suggests that the upward move is backed by real investor demand. Conversely, a breakout with low volume may be weak and prone to reversal.
Correlating volume with price movement allows traders to confirm trends and avoid false signals. For instance, a rising price on low volume may indicate that the trend is not sustainable, while a falling price with increasing volume could signal a strong downward trend. Beginners should always consider volume alongside price to improve their decision-making. Using volume effectively on financial charts provides a clearer picture of market dynamics, helping traders identify strong moves and potential opportunities with confidence.
Trendlines and Chart Patterns
Trendlines are straight lines drawn on financial charts to connect successive highs or lows, showing the direction of a trend. An upward trendline connects rising lows, while a downward trendline connects falling highs. Trendlines act as support or resistance levels and help traders anticipate possible price reversals.
Chart patterns are formations created by price movements on financial charts. Common patterns include head and shoulders, triangles, and double tops or bottoms. The head and shoulders pattern often signals a reversal, while triangles indicate potential continuation or breakout points. Double tops or bottoms suggest that a trend may be ending or reversing.
Recognizing patterns on financial charts allows traders to predict potential price changes before they occur. For instance, spotting a triangle forming near a support level may indicate a breakout is coming. Combining trendlines with chart patterns improves analysis accuracy and helps beginners plan entry and exit points. Learning to draw and interpret these features is crucial for developing confidence in chart reading and making informed trading decisions.
Time Frames in Charts
Time frames are a crucial element of financial charts. They represent the period each data point covers, such as one minute, one hour, one day, or one week. Short-term charts are useful for day traders looking to make quick trades, while long-term charts help investors identify broader trends over months or years.
Using multiple time frames enhances analysis. For example, a trader might check a daily chart to understand the overall trend and a one-hour chart to find precise entry points. Different time frames can reveal hidden patterns and clarify market direction.
The choice of time frame also affects decision-making. Short-term charts may show noise or minor fluctuations that could mislead beginners, while long-term charts provide a bigger picture of the market trend. Understanding time frames on financial charts allows traders to align their strategies with their goals, whether for day trading or long-term investing.
Common Mistakes Beginners Make
Beginners often make mistakes when reading financial charts, which can affect trading results. One common error is overcomplicating charts with too many indicators, making it difficult to see trends. Simpler charts are often easier to analyze.
Ignoring volume or key indicators is another frequent mistake. Without considering volume, traders may misinterpret price movements, leading to poor decisions. Additionally, following hype instead of signals from financial charts can result in impulsive trades. Social media trends or news alone should not dictate buying or selling decisions.
Understanding these pitfalls helps beginners develop disciplined chart analysis habits. By focusing on price, volume, trendlines, and simple indicators, traders can avoid mistakes and make more informed decisions. Awareness of common errors is the first step toward becoming proficient with financial charts and improving long-term trading success.
Practical Tips to Improve Chart Reading Skills
Improving chart reading skills requires consistent practice and focus. Beginners should start with one type of financial chart, such as candlestick charts, to avoid confusion. Learning the basics first ensures a solid foundation before adding complexity.
Practicing on demo accounts or reviewing historical data is essential. It allows traders to test strategies without risking real money. Observing how price, volume, and indicators interact on financial charts builds understanding and confidence.
Keeping a trading journal is another practical tip. Recording observations, mistakes, and outcomes helps track progress and refine techniques. Regular review of charts and journal notes enhances learning and reinforces key concepts. By following these steps, beginners can steadily improve their ability to read financial charts like a pro and make informed trading decisions.
Conclusion
Understanding financial charts is essential for anyone looking to trade or invest successfully. By mastering the basics, reading price movements, analyzing volume, identifying trendlines, and using technical indicators, beginners can make more informed decisions. Avoiding common mistakes, focusing on simple patterns, and practicing regularly improves confidence and accuracy. Utilizing multiple time frames and combining chart tools enhances the ability to spot trends and opportunities. With patience, discipline, and consistent learning, financial charts can become a reliable guide for predicting market movements and planning trades. By applying these strategies, beginners can grow into proficient chart readers and make smarter investment choices.
FAQs
Which type of chart is best for beginners?
For beginners, line charts or simple candlestick charts are recommended. Line charts show price movements over time and are easy to interpret, while candlestick charts provide more detail about opening, closing, high, and low prices. Starting with basic charts helps beginners understand trends, reversals, and market behavior without being overwhelmed. As knowledge grows, more complex charts with multiple indicators can be incorporated to improve accuracy and trading decisions.
How can I identify trends on financial charts?
Trends are identified by observing the general direction of price movement. An upward trend forms when prices consistently make higher highs and higher lows, while a downward trend shows lower highs and lower lows. Horizontal price movement indicates a sideways trend or consolidation. Trendlines drawn on charts can help visualize these trends, allowing traders to plan entries and exits. Understanding trends is essential for predicting future price movements and making strategic investment decisions.
What mistakes should beginners avoid?
Beginners should avoid overcomplicating charts with too many indicators, ignoring trading volume, and following market hype without analysis. Emotional trading based on fear or greed can also lead to poor decisions. Focusing on key elements like price trends, support and resistance, and practicing regularly helps avoid these mistakes. Starting simple, maintaining a trading journal, and learning from experience are effective ways to improve financial chart reading skills over time.
How can I practice reading financial charts effectively?
Practicing with demo accounts or historical market data is a safe way to learn. Start with one chart type, observe price movements, and note patterns in a trading journal. Use paper trading or simulation tools to test strategies without risking money. Consistent practice helps beginners understand trends, volume, and technical indicators. Over time, analyzing charts daily strengthens decision-making skills and builds confidence in interpreting market behavior accurately.
What are support and resistance levels on charts?
Support is the price level where an asset tends to stop falling and may bounce back up, while resistance is where prices often stop rising. Identifying these levels on financial charts helps traders plan entry and exit points. Support and resistance indicate market psychology, showing areas where buyers or sellers dominate. Learning to spot them early allows investors to manage risk and make strategic decisions.